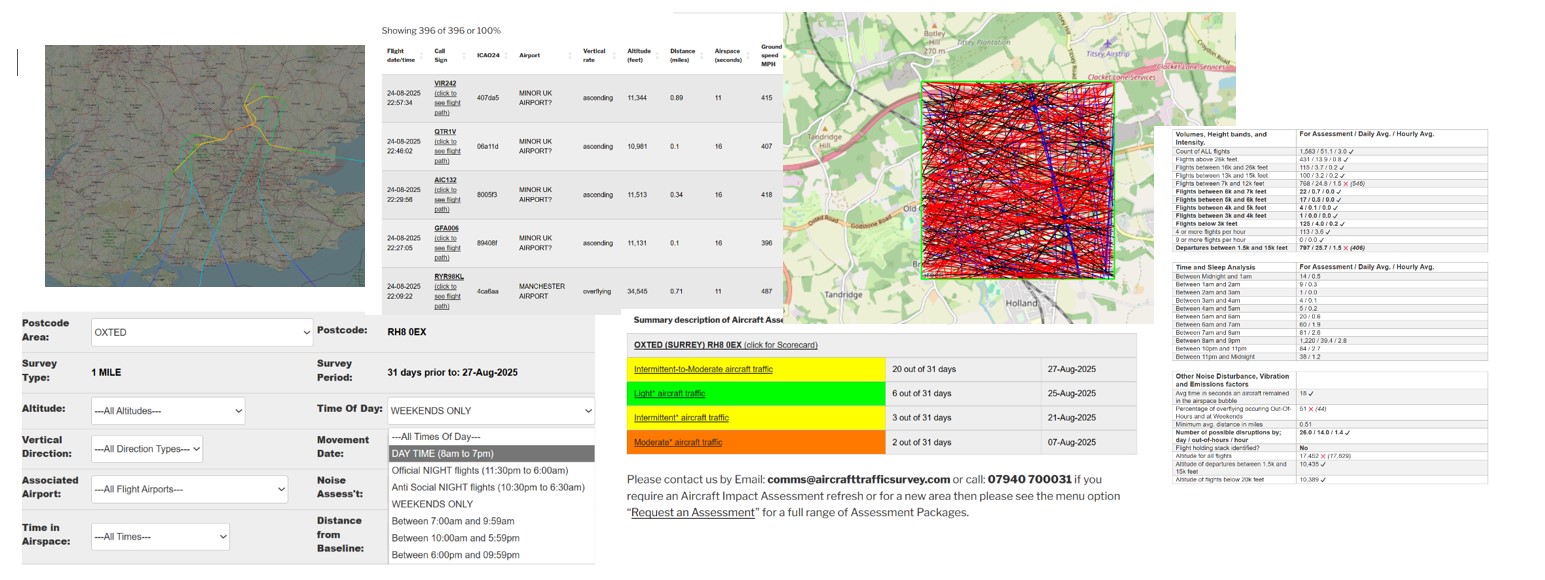
Subject to availability from of the OpenSky Network’s data feed, data quality not verified.
The following is our latest Arrival and Departure movement activity for a selection of Airports – the first table column is the analysis week. The list of Airports shown can be expanded by sending a request to comms@aircrafttrafficsurvey.com. Note; all movement counts are derived on where a flight was first or last seen using Automatic Dependent Surveillance-Broadcast (ADS-B) and Mode S technologies.
The table is refreshed on Tuesday mornings. The sort can be changed dynamically by clicking on the column header.
| Week | Airport | All Movements | Projected Year-On-Year growth% | Night Time (UK Planning Mvts.) | Night Time (Anti-Social Mvts.) |
|---|---|---|---|---|---|
| w/e 08-Feb-2026 | ABERDEEN DYCE AIRPORT (click to see Chart) | 1024 | -6.4 | 13 | 43 |
| w/e 08-Feb-2026 | BIRMINGHAM INTERNATIONAL AIRPORT (click to see Chart) | 1420 | 0.9 | 35 | 120 |
| w/e 08-Feb-2026 | BOURNEMOUTH AIRPORT (click to see Chart) | 218 | -1.3 | 1 | 5 |
| w/e 08-Feb-2026 | BRISTOL AIRPORT (click to see Chart) | 1071 | -5.5 | 18 | 83 |
| w/e 08-Feb-2026 | EAST MIDLANDS AIRPORT (click to see Chart) | 713 | 3.9 | 248 | 310 |
| w/e 08-Feb-2026 | EDINBURGH AIRPORT (click to see Chart) | 1881 | 2.0 | 47 | 191 |
| w/e 08-Feb-2026 | FARNBOROUGH AIRPORT (click to see Chart) | 426 | 6.2 | 0 | 1 |
| w/e 08-Feb-2026 | GEORGE BEST BELFAST CITY AIRPORT (click to see Chart) | 533 | -6.7 | 0 | 1 |
| w/e 08-Feb-2026 | GLASGOW INTERNATIONAL AIRPORT (click to see Chart) | 1165 | 3.4 | 19 | 55 |
| w/e 08-Feb-2026 | GLASGOW PRESTWICK AIRPORT (click to see Chart) | 130 | -10.7 | 20 | 25 |
| w/e 08-Feb-2026 | LEEDS BRADFORD AIRPORT (click to see Chart) | 407 | -13.1 | 0 | 17 |
| w/e 08-Feb-2026 | LONDON BIGGIN HILL AIRPORT (click to see Chart) | 270 | -8.1 | 0 | 0 |
| w/e 08-Feb-2026 | LONDON CITY AIRPORT (click to see Chart) | 934 | -2.1 | 0 | 1 |
| w/e 08-Feb-2026 | LONDON GATWICK AIRPORT (click to see Chart) | 3509 | -6.6 | 106 | 232 |
| w/e 08-Feb-2026 | LONDON HEATHROW AIRPORT (click to see Chart) | 8427 | 6.4 | 125 | 404 |
| w/e 08-Feb-2026 | LONDON LUTON AIRPORT (click to see Chart) | 2021 | 3.9 | 45 | 161 |
| w/e 08-Feb-2026 | LONDON STANSTED AIRPORT (click to see Chart) | 3371 | 3.4 | 155 | 384 |
| w/e 08-Feb-2026 | MANCHESTER AIRPORT (click to see Chart) | 3063 | 4.7 | 112 | 277 |
| w/e 08-Feb-2026 | SOUTHAMPTON AIRPORT (click to see Chart) | 333 | -0.1 | 0 | 1 |
| w/e 08-Feb-2026 | SOUTHEND AIRPORT (click to see Chart) | 117 | 56.5 | 0 | 5 |
| Week | Airport | All Movements | Projected Year-On-Year growth% | Night Time (UK Planning Mvts.) | Night Time (Anti-Social Mvts.) |
