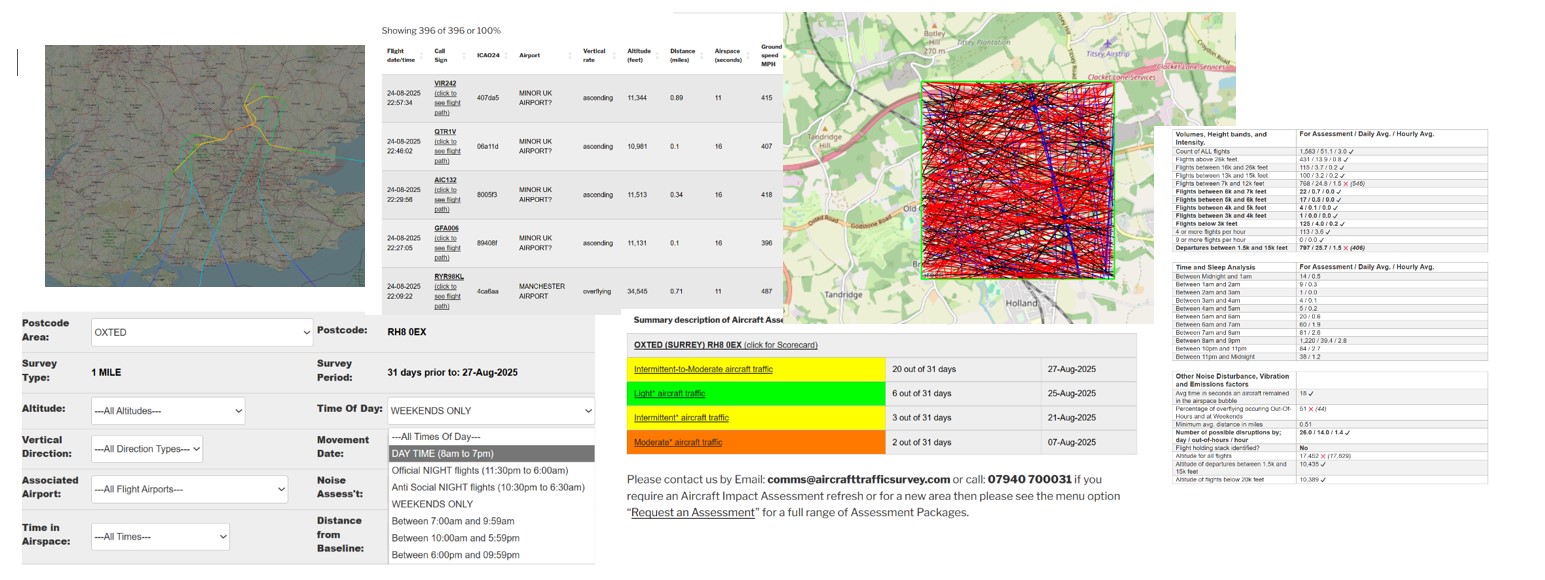
Our standard model for the Assessment Index is a weighted lag indicator that represents the expected level of disruption caused by aircraft traffic at a specified location. The higher the index value for a location the higher will be the expected level of disruption caused by the aircraft, both visually and by noise output.
However, if the number of the disturbance flight events is less than 2 within a single hour then those 2 events are considered as one-off and not included within the Index.
Refinements to our standard model are possible, please see our customised survey offering.
The scale of disruption is categorised by eight bands as shown in the table below.
| Value | Description |
|---|---|
| None | There are no detectable regular disruptions. |
| Minimal | Minimal regular aircraft disruptions i.e. not frequent or regular. The Index range is between 0.1 and 3.9. |
| Occasional | The are Occasional but irregular aircraft disruptions. It is highly likely the location is on a flight route. The Index range is between 4 and 6.9 |
| Regular | Regular aircraft disruptions i.e. tends to be regular and will be noticeable at defined times of the day. It is highly likely the location is on a flight route or even on a secondary flight corridor. The Index range is between 7 and 11.9. |
| Frequent | Frequent aircraft disruptions i.e. tends to be regular and will be noticeable multiple times of the day. It is highly likely the location is on a flight corridor or in a flight holding stack. The Index range is between 12 and 15.9. |
| High | High volumes of aircraft disruptions i.e. tends to be very regular and will be noticeable at anytime of the day. It is highly likely the flights are low and the location is on multiple flight paths, or primary flight corridors or a holding stack. The Index range is between 16 and 19.9. |
| Very High | Very High volumes of aircraft disruptions i.e. tends to be very regular and will be noticeable at anytime of the day. It is highly likely the flights are low and the location is on a departure and arrivals flight path. The Index range is between 20 and 25.9. |
| Extremely High | Extremely High volumes of aircraft disruptions i.e. tends to be very regular and will be noticeable at anytime of the day. It is highly likely the flights are low and the location is on a flight path or primary flight corridor. The Index range is 26 upwards. |
NOTES:
- Aircraft disturbance is subjective and its effect can be impacted by other background sounds such as road noise.
- Your life-style. I.e. those working from home or retired tend to be more sensitive to aircraft disturbances that occur throughout the day.
- Aircraft flights frequently occur at weekends, on Bank Holidays and also between 6.00 pm and 7.00 am Monday to Friday. This makes it easy to under estimate the scale of aircraft disturbances as at these times it’s difficult to survey manually.
