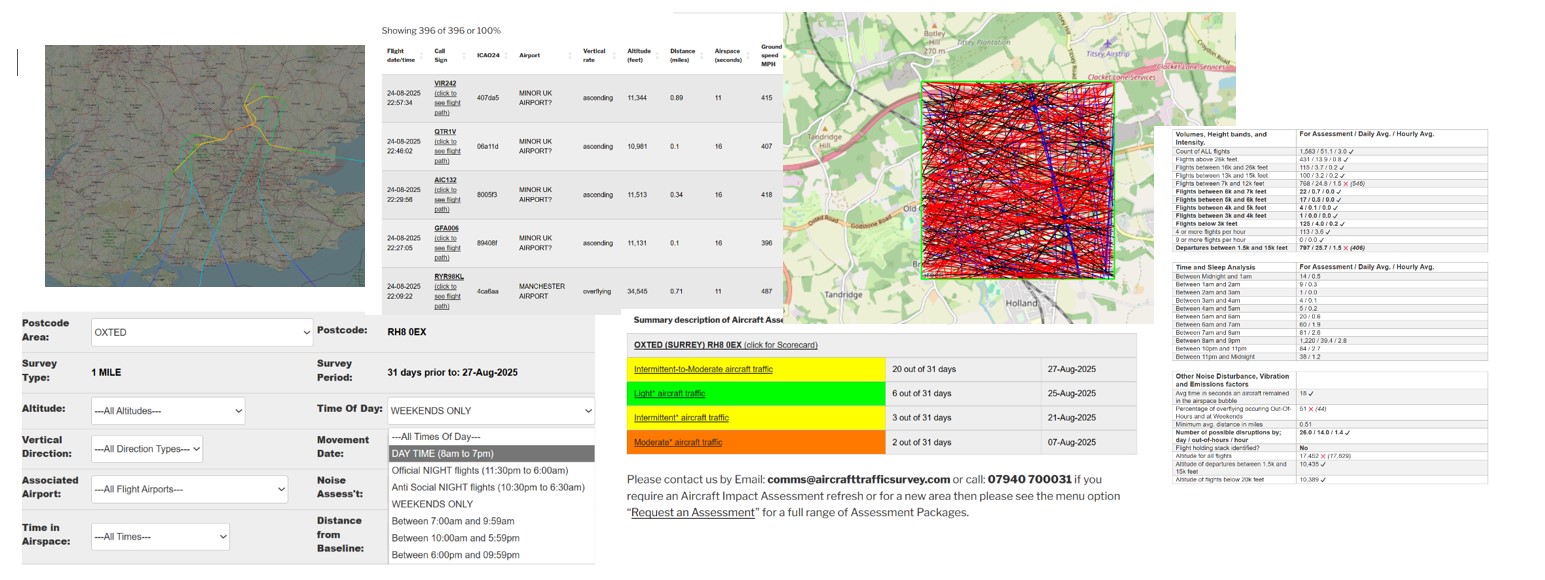
The interactive UK map below shows the location of all the virtual Noise Assessment stations. By zooming in and then identifying an individual Assessment Pin you will then be able to see the results from the last Assessment performed at that location.
Additionally the map has the ability to filter on Assessment outcomes such as areas that have Light aircraft traffic, colour coded green, as opposed to those areas with Heavy or continuous aircraft traffic movements, colour code red.
UK Postcode Aircraft Noise Assessments + UK Airport Watch
UK Postcode Aircraft Noise Assessments + UK Airport Watchnd disturbance algorithms working for our local communities and home buyers. Updated daily.