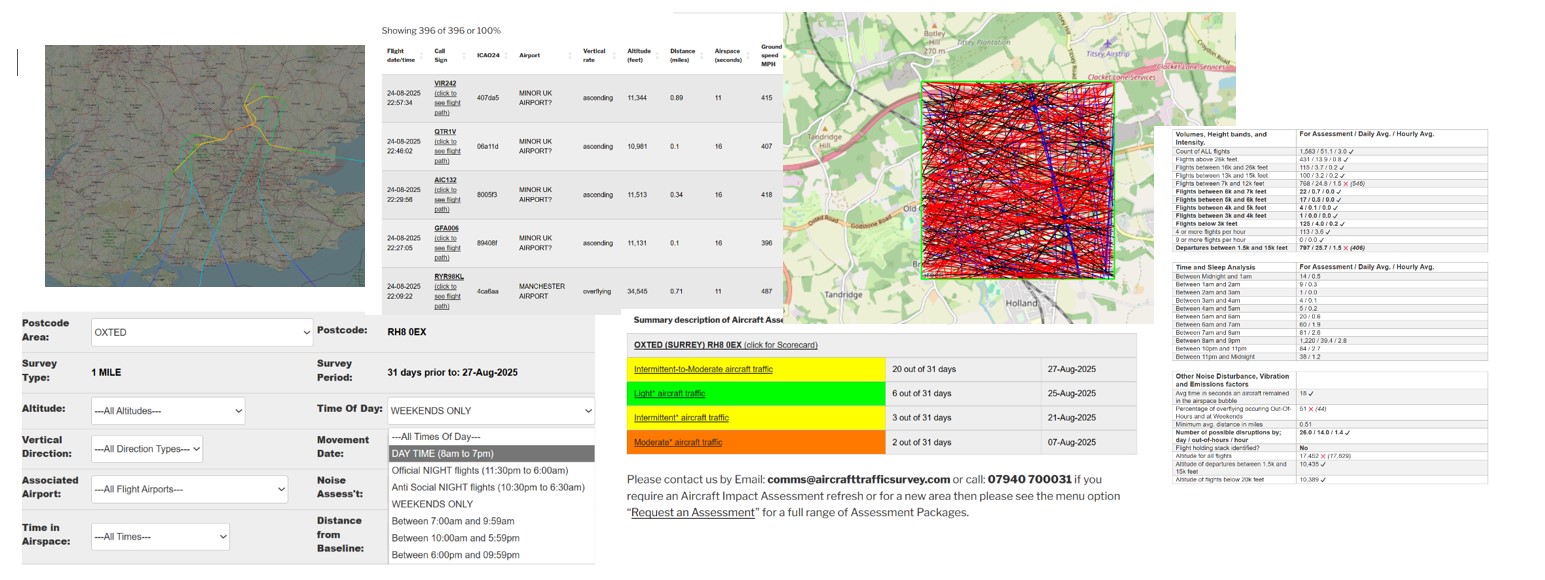
The total Arrival & Departure airport movements for the past week are shown below. The content is refreshed on Tuesday mornings. Note. Officially UK planners determine a night flight as a flight that landed or departed fron an airport between the times of 11:30pm and 6:00am. However, for our analysis, we also include an Anti-Social Night Flight metric that includes flights between 10:29pm and 6:30am when the majority of people are naturally at rest and where the ambient background noise is low.
For further information about the airport’s location and flight volumes for prior 12+ months then simply click on the airport’s name.
Additional airports can be monitored by sending a request to comms@aircrafttrafficsurvey.com.
| Week | Airport | All Movements | Projected Year-On-Year growth% | Night Time (UK Planning Mvts.) | Night Time (Anti-Social Mvts.) |
|---|---|---|---|---|---|
| w/e 15-Feb-2026 | ABERDEEN DYCE AIRPORT (click to see Chart) | 942 | -8.7 | 6 | 27 |
| w/e 15-Feb-2026 | BIRMINGHAM INTERNATIONAL AIRPORT (click to see Chart) | 1042 | -7.7 | 25 | 85 |
| w/e 15-Feb-2026 | BOURNEMOUTH AIRPORT (click to see Chart) | 161 | -9.9 | 1 | 4 |
| w/e 15-Feb-2026 | BRISTOL AIRPORT (click to see Chart) | 838 | -13.1 | 17 | 77 |
| w/e 15-Feb-2026 | EAST MIDLANDS AIRPORT (click to see Chart) | 571 | -0.5 | 201 | 253 |
| w/e 15-Feb-2026 | EDINBURGH AIRPORT (click to see Chart) | 1357 | -6.3 | 36 | 127 |
| w/e 15-Feb-2026 | FARNBOROUGH AIRPORT (click to see Chart) | 387 | -4.2 | 1 | 1 |
| w/e 15-Feb-2026 | GEORGE BEST BELFAST CITY AIRPORT (click to see Chart) | 393 | -8.8 | 0 | 1 |
| w/e 15-Feb-2026 | GLASGOW INTERNATIONAL AIRPORT (click to see Chart) | 880 | -3.7 | 11 | 39 |
| w/e 15-Feb-2026 | GLASGOW PRESTWICK AIRPORT (click to see Chart) | 102 | -15.8 | 12 | 17 |
| w/e 15-Feb-2026 | LEEDS BRADFORD AIRPORT (click to see Chart) | 267 | -15.7 | 2 | 13 |
| w/e 15-Feb-2026 | LONDON BIGGIN HILL AIRPORT (click to see Chart) | 212 | -25.3 | 0 | 0 |
| w/e 15-Feb-2026 | LONDON CITY AIRPORT (click to see Chart) | 831 | -5.8 | 0 | 0 |
| w/e 15-Feb-2026 | LONDON GATWICK AIRPORT (click to see Chart) | 2755 | -16.2 | 78 | 190 |
| w/e 15-Feb-2026 | LONDON HEATHROW AIRPORT (click to see Chart) | 6224 | -0.2 | 86 | 309 |
| w/e 15-Feb-2026 | LONDON LUTON AIRPORT (click to see Chart) | 1533 | -7.1 | 17 | 98 |
| w/e 15-Feb-2026 | LONDON STANSTED AIRPORT (click to see Chart) | 2338 | -5.4 | 121 | 277 |
| w/e 15-Feb-2026 | MANCHESTER AIRPORT (click to see Chart) | 2242 | -4.9 | 73 | 202 |
| w/e 15-Feb-2026 | SOUTHAMPTON AIRPORT (click to see Chart) | 264 | -4.4 | 2 | 2 |
| w/e 15-Feb-2026 | SOUTHEND AIRPORT (click to see Chart) | 108 | 40.6 | 0 | 5 |
| Week | Airport | All Movements | Projected Year-On-Year growth% | Night Time (UK Planning Mvts.) | Night Time (Anti-Social Mvts.) |
