4C.2 Aircraft noise is a particularly difficult issue for London, given the location
of one of the world’s busiest airports, and a key UK global gateway, on its
western edge. With the prevailing wind direction from the west, this means
that most aircraft descending to land at Heathrow Airport approach over
the city. Aircraft using other airports, including outside the city, also pass
over London. Many Londoners are concerned about aircraft noise.
4C.6 The Mayor’s Transport Strategy recognises that provision of adequate
airport capacity to meet London’s needs, as a world city and the
international gateway to the UK, is important. However, London’s
environment also needs to be protected (Transport Strategy, Policy 4L.1).
Noise is, of course, one of the key environmental issues for air transport,
along with air quality, and, increasingly, greenhouse gas emissions. The
120 Mayor of London The Mayor’s Ambient Noise Strategy
The Mayor’s Ambient Noise Strategy Mayor of London 121
Mayor has stated that he supports ending the exemption of aviation fuel
from taxation to help reduce unnecessary air journeys (Transport Strategy,
paragraph 4L.12). However, reduction in general demand for air travel
would not automatically be expressed in equivalent reductions in demand
at a particular airport that was more popular and accessible to travellers
than other airports; general and location-specific noise management
would still be needed.
4C.11 After the 2002 Chapter 2 phase-out, there is no immediate prospect of a
technological advance giving a similar reduction to that achieved through
introduction of high by-pass engines.15 The 2001 ICAO decision on a new
Chapter 4 aircraft noise standard did not secure the degree of
improvement many had pressed for. European negotiators seeking quieter
aircraft at ICAO were outvoted by those from other parts of the world
whose priority was cheaper aircraft. The ICAO decision effectively pushes
the onus onto regulators, airport operators and land use planners in
countries where noise sensitive airports are located.
4C.12 A Government-commissioned study of aviation technology futures16 made
it clear that significant further progress on noise reduction would only be
implemented if regulatory agencies created the right framework. The life
of an airframe may be forty years, compared with around ten for a road
vehicle, so the impact of quieter new aircraft on overall noise levels will
be slow unless instruments, such as higher landing charges at more noisesensitive airports, higher fuel prices,
incentives for scrapping, or other
measures are used to encourage removal of those aircraft which are more
polluting and/or less fuel efficient.
4C.13 Reductions in aircraft noise at take-off, dominated by engine noise, have
been more significant than when landing. Noise from aerodynamic
sources, from the airframe, such as control surfaces, and undercarriage,
has been becoming more significant. Landing noise is more complex to
control. With construction of Heathrow Terminal 5, increases in the
proportion of larger aircraft can be expected. Increases in perceived noise
under the final approach glidepaths east of Heathrow Airport are likely.
Airlines can be encouraged to use quieter aircraft through landing fees. At
Heathrow, differential landing charges are applied. In 2000/2001, Chapter
2 aircraft (see glossary) were required to pay double the landing fee,
compared with Chapter 3. The noisiest Chapter 3 aircraft paid 10% more,
and the quietest 10% less. A supplementary noise quota system is
operated at night to encourage the use of quieter aircraft.
4C.15 Take-off noise has traditionally been seen as of greater concern than
landing noise. Take-off has been where the main improvements in aircraft
technology, principally from reducing engine noise, have been made. The
‘noise footprint’ at take-off has been significantly reduced, as modern
aircraft are able to climb much more steeply. At Heathrow, complaints
about departure noise have fallen considerably.
4C.18 Most complaints about noise associated with Heathrow now concern
aircraft coming in to land. At Heathrow aircraft continue to need to
approach at a standard 3 degree glideslope. London City Airport, with
specific obstacle clearance requirements, is exceptional in being limited to
use by aircraft which can approach more steeply. Steeper approach
reduces the area affected, but would be demanding for some aircraft
types (some would require special certification), and steeper approach
procedures are only permitted under international procedure design
criteria (PANS-OPS) for the purpose of obstacle clearance. Aircraft are
required to join the glide path (see glossary) at or above 2,500 feet in
daytime, and 3,000 feet at night. When aircraft are approaching towards
The Mayor’s Ambient Noise Strategy Mayor of London 127
the west (the predominant mode of operation at Heathrow) the
glideslope may extend across London as far as Greenwich.
4C.19 Much of the noise produced during descent to landing is aerodynamic,
including from flaps and undercarriage. An ANMAC study (see glossary)
concluded that specific measured arrivals noise limits were not practicable.
Regular monitoring and reporting of approach noise and close working
between the airport operator, airlines and air traffic control are all
necessary to achieve improvements. Continuous Descent Approach (CDA)
is a noise abatement technique for arriving aircraft which avoids the higher
noise levels generated when aircraft descend in steps (see glossary). At
Heathrow, CDA achievement during the 2300 to 0600 period improved
from 73% in the second quarter of 1999 to 88% in the third quarter of
- The airport operator has a target to increase this to 90% of arrivals
by December 2004.18 A Code of Practice has been developed to reduce
noise from each aircraft arrival.19 Low engine power settings during CDA
reduce fuel use, and the aircraft is generally higher than in a stepped
approach. Much of the noise is from the turbofan assembly and is tonal in
quality. People tend to find tonal noise more annoying at a given level.
4C.20 Future changes to international air traffic management include integrated
‘gate to gate’ operational systems, and ‘area navigation’ procedures
(RNAV, see glossary), with the prospect of adjustments to the present
structure of departure routes. Reducing the need for entering one of the
four ‘holding stacks’ around London, would not necessarily reduce the
need for integrating different traffic streams for final approach. Airspace
management is the responsibility of the Civil Aviation Authority/National
Air Traffic Services. Air traffic controllers use a variety of rules, procedures
and practices designed to ensure the safe and expeditious separation and
sequencing of aircraft. The structure of controlled airspace over London
has been built up over a long period. Any major redesign would have
widespread ‘knock on’ implications. Aircraft positioning for approach to
Heathrow are not necessarily required to enter a holding pattern, or be
constrained to a particular standard arrival route. Aircraft may, depending
on air traffic conditions, weather conditions and other factors, be directed
and sequenced to final approach in a variety of ways.
4C.21 Aircraft manoeuvre over many parts of London, outside the most-affected
areas in south-west London. Many of these are manoeuvring across south
or north London to join the glideslope on their approach to Heathrow
Airport. There are also increasing movements to and from other airports in
and around London. It may not always be clear to people in Tower
Hamlets or Greenwich, for example, whether the aircraft they see are
using Heathrow, London City or other airports. Air traffic control
arrangements change only infrequently. This makes it even more
important that as complete as possible an understanding of the noise and
other environmental effects is established, so that no opportunity to
improve the situation is missed.
4C.22 Take-offs have traditionally been more of a noise problem than
landings. The balance of advantage may shift as aircraft technologies
change. This aspect of current arrangements requires periodic review.
4C.39 Consultative committees provide for communication and consultation
between airports and affected communities. They provide regular
opportunities for all parties to monitor and exchange information, and to
review noise management alongside other issues, as circumstances change.
Box 47: Airport Consultative Committees
The Heathrow Airport Consultative Committee is a statutory body including
representatives of local residents, local authorities for areas both inside and
outside Greater London35, specialist groups, environmental groups and
industry bodies. The Heathrow Area Transport Forum plays an important
role in relation to surface access. A Noise and Track Keeping Working Group
studies noise reduction methods and monitors issues such as aircraft
adherence to designated routes, night engine testing, and ground noise.
Annual noise reports are published, beginning with 2000/2001, including
data on air transport movements, passenger figures, contour areas and
numbers of residents contained within them, CDA achievement, night quota
use, track keeping and infringements. Other Airport Consultative
Committees, such as at London City, perform a similar function.
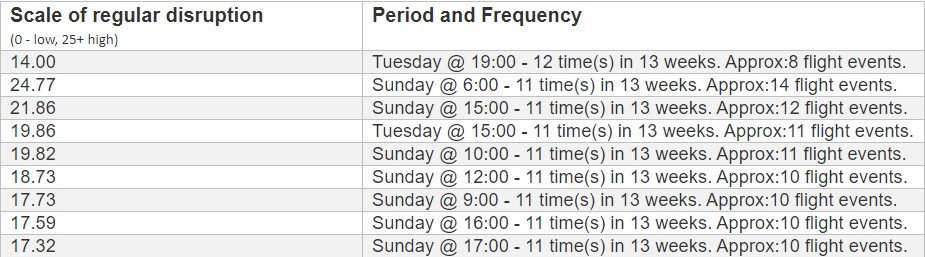
4C.41 One of the problems with the published LAeq 16 hour aircraft noise contours is
that they are being used for purposes for which they are not suitable. They
reduce a complex series of events to a single figure, which is useful for
planning, summary trends and other purposes. However, despite published
caveats, people can interpret the 57 contour as implying that people
outside it should not notice aircraft at all. In fact, a proportion of people
are annoyed at lower levels of aircraft noise. The contours only give a
generalised long term indication of overall noise energy. Particularly when
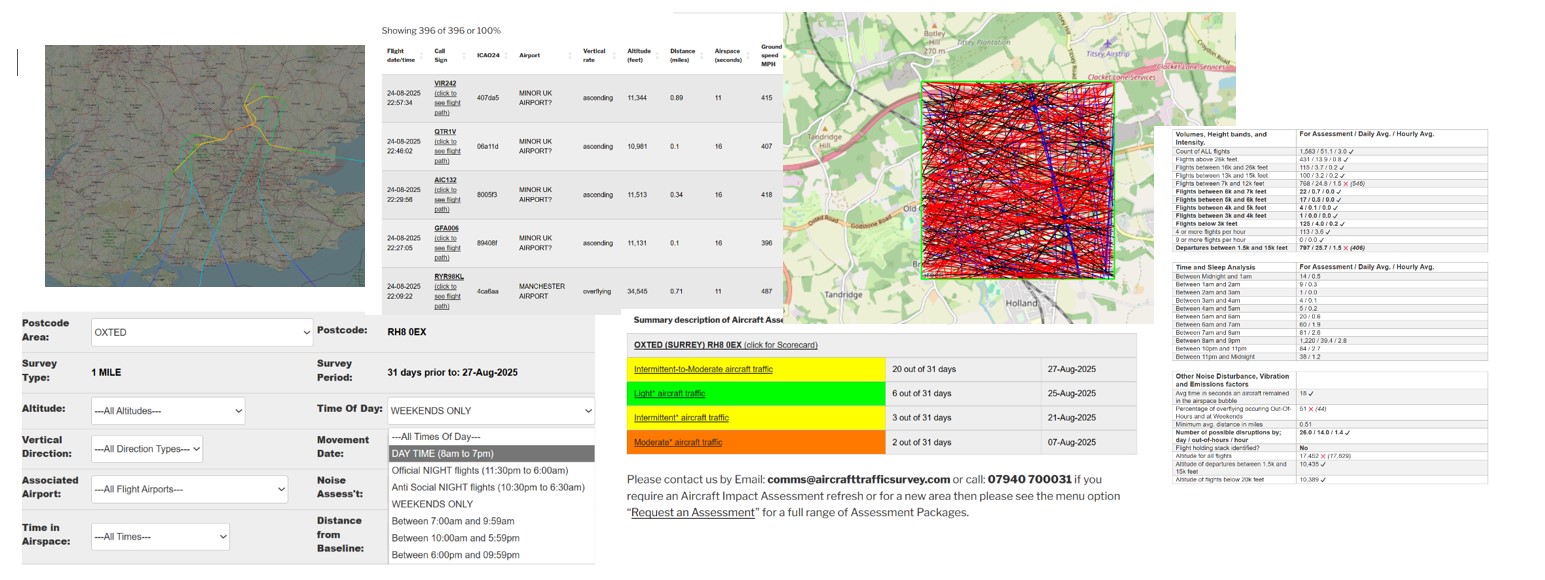
they are choosing where to live, people may want to know how many
aircraft are likely to fly over, and at what times, including whether there
are regular periods of respite. In the case of roads, railways and many other
noise sources, the physical presence of infrastructure in the vicinity of a
house may alert a buyer, while aircraft may not be using a relevant
flightpath when buyers inspect. Better information on the probability of
overflight could also be useful when people are visiting historic parks or
gardens, nature reserves, or making other plans for open air activity.
4C.43 Heathrow Airport is the largest air freight facility in the UK, handling
some 56% of all UK air cargo in 2002.1 The vast majority of air freight
using Heathrow is carried in the holds of passenger aircraft. Freight-only
aircraft are concentrated at Stansted. Luton is a centre for night courier
operations. Air freight shipping and forwarding is a major activity in the
Heathrow area, which assembles air freight consignments for other
airports. The Mayor’s Air Quality Strategy has highlighted air quality issues
in the Heathrow area, and seeks to encourage lower emission vehicles.
The use of the quietest available vehicles for inter-airport and other night
movement of freight needs to be encouraged. The Heathrow Joint
Distribution Centre for airport retailing has reduced the number of service
delivery vehicles entering the airport. This is an important initiative with
wider implications for demonstrating how load consolidation can reduce
the environmental impact, including noise, of freight vehicles.