Making sense of the Aircraft Traffic Assessment Scorecard.

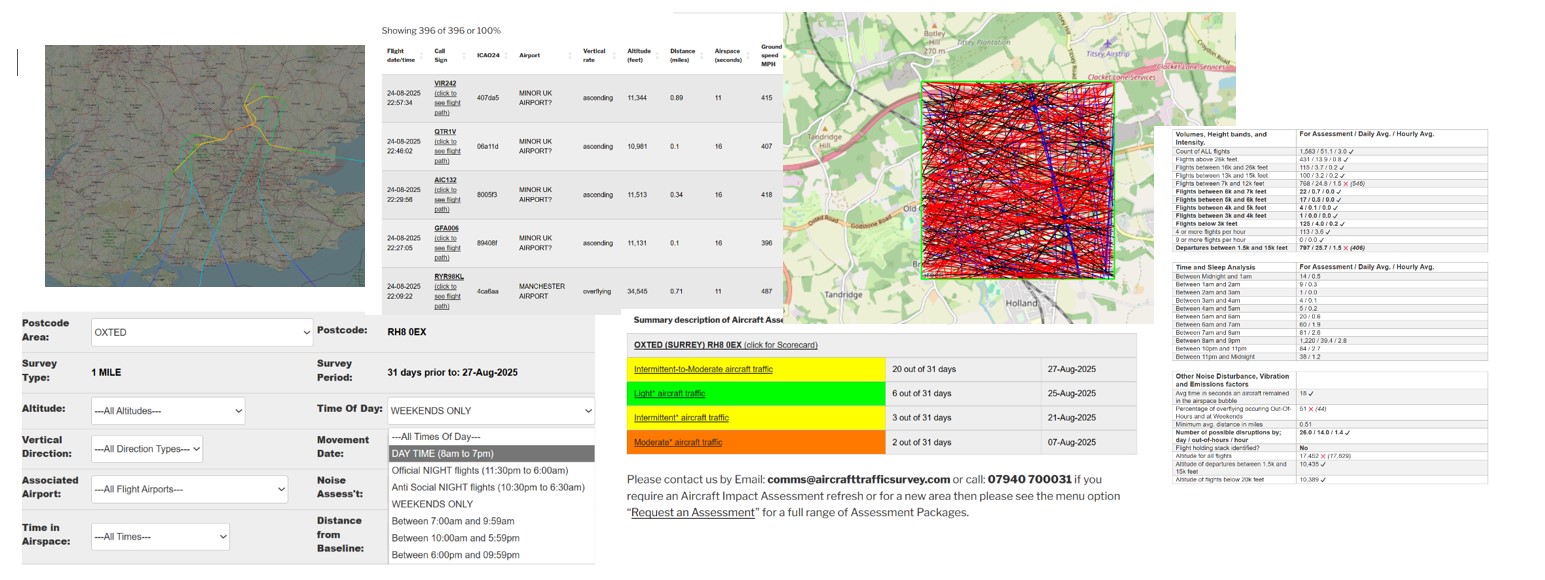
This article explains how to make sense of the information contained within the Aircraft Traffic Assessment Scorecard, both for the Full and 31 Day assessments.
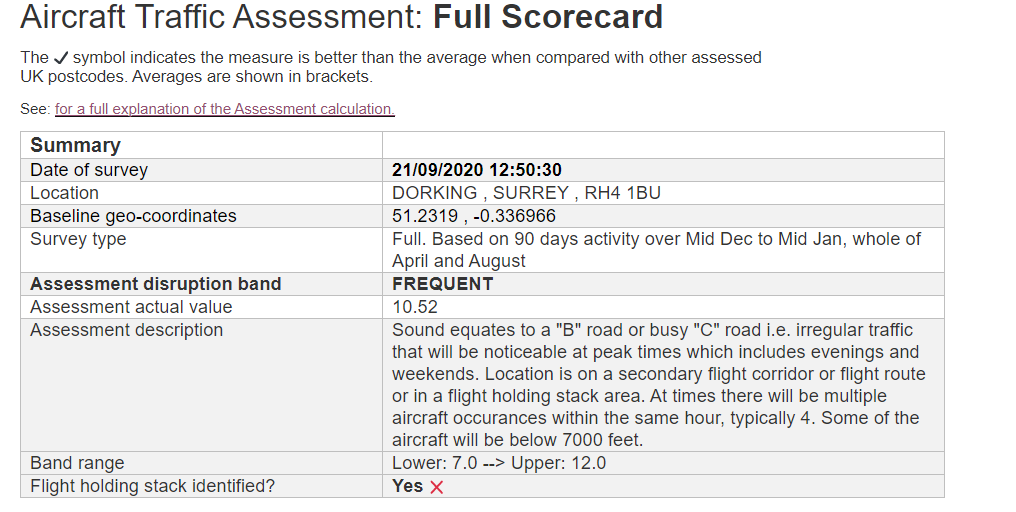
Date of SurveyFor the 31 Day Scorecard the date represents the end date and time for the survey. The start date and time is calculated 31 days earlier.

Whereas for the Full Scorecard the date represents when the survey was requested and is for information only.
LocationIs the identifier for the location being surveyed.
Baseline geo-coordinatesThe geo-coordinates, Lat & Long, are used to define the centre of the 1 mile Assessment airspace bubble. Typically this is the actual location of the point-of-interest.
Survey TypeDescribes the type of assessment survey being reported. The full survey analyses 93 days of flight events based on 2019. The 31 Day survey uses the actual survey date, see above.
Assessment disruption bandThe Assessment band category e.g. FREQUENT, OCCASIONAL, VERY HIGH etc. This is an important measure.
Assessment disruption valueThe actual Assessment value. Useful for gaining an understanding where the location sits within the disruption band i.e. bottom, middle or top. This is an important measure.
Assessment descriptionA description that attempts to relate the Assessment to an equivalent road noise.
Band range.Shows the lower and upper levels for the Assessment band. Designed to be used in conjunction with the Assessment disruption value. This is important data.
Flight holding stack identified?If a fight holding stack is identified the returned value is ‘YES’. Meaning planes will be held in a holding loop at between 7,000-12,000 feet. Multiple planes can exist in the stack at the same time and the planes are in “fly” mode i.e. not gliding.
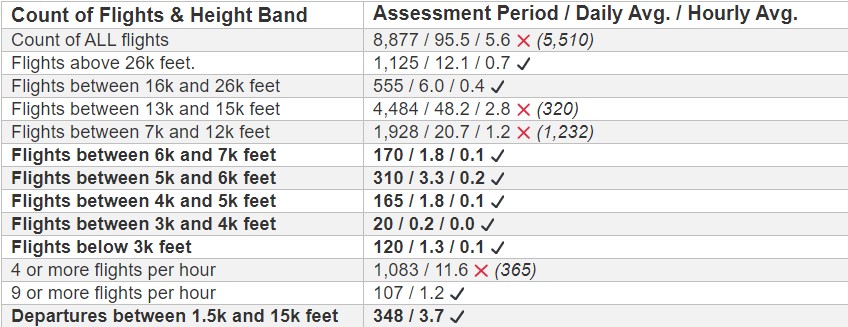
Count of ALL flightsThe total number of flights that occurred within the Assessment postcode for the entire period and then averaged by day and by hour. All flights are included, however those above 35,000 feet will have little impact.
Flights above 26,000 feetThe total number of flights that occurred above 26,000 feet within the Assessment airspace. Flights between 26,000 and 35,000 feet can be heard from the ground. Flights at this height are someway from the destination airport.
Flights between 16,000 and 26,000 feetThe total number of flights that occurred between 16,000 and 26,000 feet within the assessment period. Flights at this height implies the area is being overflown and the airspace is being used by 1 or more airports.
Flights between 13,000 and 16,000 feetAs above but between 13,000 and 16,000 feet. However, the planes will be clearly heard from the ground and will be clearly visible.
Flights between 7,000 and 12,000 feetAs above but between 7,000 and 12,000 feet. This is the height that most planes are held within holding stacks prior to landing.
Flights between 6,000 and 7,000 feetThe total number of flights that occurred between 6,000 and 7,000 feet. Planes leave their holding position at this height ready for final descent.
Flights between 5,000 and 6,000 feet
Flights between 4,000 and 5,000 feet
Flights between 3,000 and 4,000 feet
The total number of flights that occurred between 6,000 and 3,000 feet. At this height it implies the planes have recently departed or are about to land. Both scenarios will be relatively noisy.
Flights below 3,000 feetSee above but very visual too.
4 or more flights per hourThe count of occurrences where 4 or more flights occurred within a single 60 minute period. For a flight to qualify it has to be below 26,000 feet. 4 flights within 60 minutes averages a flight every 15 minutes which gives the impression of a continuous background noise/rumble.
9 or more flights per hourThe count of occurrences where 9 or more flights occurred within a single 60 minute period. For a flight to qualify it has to be below 26,000 feet. 9 flights within 60 minutes averages a flight every 7 minutes which gives the impression of a continuous background noise/rumble.
Departures between 1,500 and 15,000
feet
The total number of departures between 1,500 and 15,000 feet within the assessment period. Departures tend to be noisier than Arrivals.
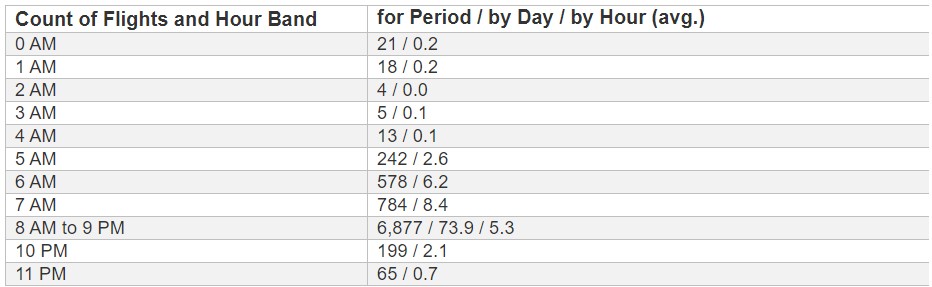
Hours between 0:00 AM and 7:59 AMThe 2 values shown represent; 1) count of aircraft movements that occurred within a one hour period for the duration of the Assessment [93 days for the Full Assessment and 31 for the Latest Assessment], and 2) the average occurrences per day per hourly period.

Planes below 26,000 feet occurring these times are very likely to disturb sleep patterns.
Hours between 8:00 AM and 9:59 PMAs above but also includes a 3rd value that represents the average count per hour within the 14 hour period (8:00am – 10:00pm)
Hours between 10:00 PM and 11:59 PMAs above. Planes below 26,000 feet occurring these times are very likely to disturb sleep patterns.
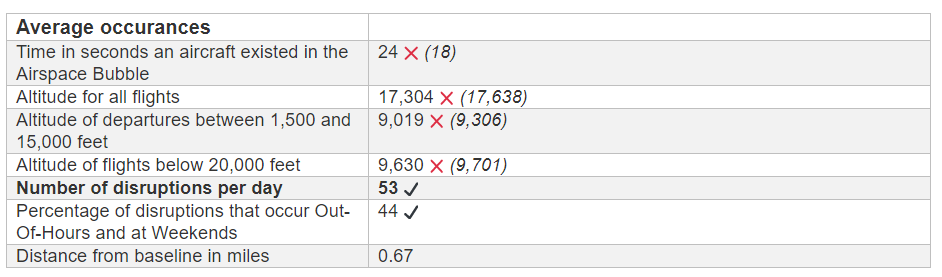
Time in seconds an aircraft existed in the
Airspace Bubble
The average time in seconds it takes for a flight to travel through your airspace bubble which as a radius of 1 mile. The longer the period the greater will be the level of disruption.
Altitude for all flightsThe average altitude for all flights passing through the area.
Altitude of departures between 1,500 and
15,000 feet
The average altitude for Departing flights that are between 1,500 and 15,000 feet.
Altitude of flights below 20,000 feetThe average altitude for all flights passing through the area that are below 20,000 feet.
Number of disruptions per dayThe average daily number of disruptions to expect. Note: please see our article about how the disruption is calculated. This is an important measure.
Percentage of disruptions that occur
Out-Of-Hours and at Weekends
The percentage of disruptions that occur at weekends and/or after hours.
Distance from baseline in milesThe average distance the disruptive flight was from the baseline co-ordinates, in fractions of a mile
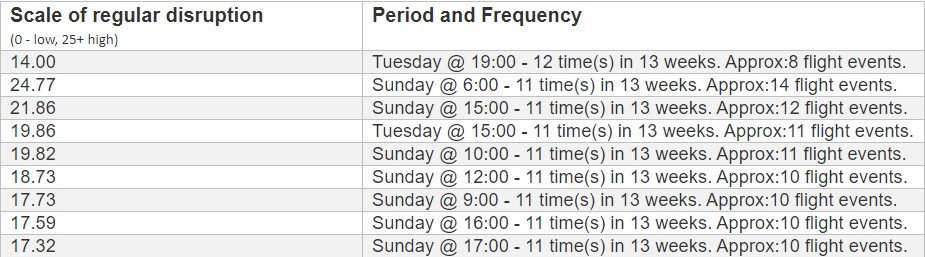
Scale of regular disruptionPrior to making your final decision we recommend you validate our Assessment by an actual site visit. The scorecard includes a list of 10 dates and times when the disruptions are most likely to occur.
Period and Frequency. E.g. Sunday @ 6:00 – 11 time(s) in 13 weeks. Approx:14 flight events.

This example states that on Sunday mornings between 6:00am – 6:59am there is regularly* 14 flights over the postcode area.

* 11 occurrences within the 13 week or 4 week Assessment period.

How the Assessment Index is calculated

Our standard model for the Assessment Index is a weighted lag indicator that represents the expected level of disruption caused by aircraft traffic at a specified location. The higher the index value for a location the higher will be the expected level of disruption caused by the aircraft, both visually and by noise output.

However, if the number of the disturbance flight events is less than 2 within a single hour then those 2 events are considered as one-off and not included within the Index.

Refinements to our standard model are possible, please see our customised survey offering.

The scale of disruption is categorised by eight bands as shown in the table below.

ValueDescription
NoneThere are no detectable regular disruptions.
MinimalMinimal regular aircraft disruptions i.e. not frequent or regular. The Index range is between 0.1 and 3.9.
OccasionalThe are Occasional but irregular aircraft disruptions. It is highly likely the location is on a flight route. The Index range is between 4 and 6.9
RegularRegular aircraft disruptions i.e. tends to be regular and will be noticeable at defined times of the day. It is highly likely the location is on a flight route or even on a secondary flight corridor. The Index range is between 7 and 11.9.
FrequentFrequent aircraft disruptions i.e. tends to be regular and will be noticeable multiple times of the day. It is highly likely the location is on a flight corridor or in a flight holding stack. The Index range is between 12 and 15.9.
HighHigh volumes of aircraft disruptions i.e. tends to be very regular and will be noticeable at anytime of the day. It is highly likely the flights are low and the location is on multiple flight paths, or primary flight corridors or a holding stack. The Index range is between 16 and 19.9.
Very HighVery High volumes of aircraft disruptions i.e. tends to be very regular and will be noticeable at anytime of the day. It is highly likely the flights are low and the location is on a departure and arrivals flight path. The Index range is between 20 and 25.9.
Extremely HighExtremely High volumes of aircraft disruptions i.e. tends to be very regular and will be noticeable at anytime of the day. It is highly likely the flights are low and the location is on a flight path or primary flight corridor. The Index range is 26 upwards.

NOTES:

  • Aircraft disturbance is subjective and its effect can be impacted by other background sounds such as road noise.
  • Your life-style. I.e. those working from home or retired tend to be more sensitive to aircraft disturbances that occur throughout the day.
  • Aircraft flights frequently occur at weekends, on Bank Holidays and also between 6.00 pm and 7.00 am Monday to Friday. This makes it easy to under estimate the scale of aircraft disturbances as at these times it’s difficult to survey manually.

Our personal Airspace bubble

Each of us live inside our own personal Airspace bubble but how do we know what’s going on in that bubble and whether or not that activity could disturb the quality of our lives?

In the context of this article an Airspace bubble is a 1 mile radius from a specified point such as our home, holiday location or outdoor leisure space.

This article focuses on the impact and assessment of commercial Aircraft within our personal Airspace bubbles. Firstly, we need to understand the terms such as impact and assessment before interpreting any results. Our Assessment ignores all aircraft above 26,000 feet as above this height the noise, and possible pollution, is less likely to disturb our lives. Likewise, we also ignore aircraft that share our bubble for less that 7.5 seconds as it implies any noise would not be around long enough to create a significant disturbance.

Experience has told us that real disruption is not caused by individual aircraft operating within our Airspace bubble but it’s actually the repetitive nature of multiple aircraft at regular times that has the biggest impact.

To summarise our assessment of disturbance is based on all flights that regularly share our Airspace at the same time for periods greater than 7.5 seconds and are below 26,000 feet. Therefore, our assessment could say for a location; between 8pm and 11pm on a Friday, Saturday and Sunday there is an 80% chance you will hear and/or see aircraft within a 10-15 minute period. The disturbance classification for this location, across all time periods, is: Frequent“.

Having an understanding of the facts you can now make a personally decision about whether this situation meets your life style criteria.

We all have the right to know and to make informed decisions.

Homebuyers – time to lobby for an extension to the Local Authority Searches so they document local aircraft corridors and flight paths.

Part of the process of buying a new home is for the buyer’s solicitor to perform a Local Authority search. But why? The conveyancing solicitors will say it’s to inform and protect the Homebuyers from any material surprises such as; flood plains, gases, landfill, historic land usage and permissions, planning issues, and detrimental long term town plans.

However, what the current Local Search does not include is any reference to the existence of Aircraft corridors, flight paths and known flight holding stacks within the area. Why?

One of the reasons “why” is because Local Authorities and District Councils believe they are powerless as they don’t own or manage the flight paths and corridors. Your local MP will also echo this sentiment too. So who is responsible and is the required information available?

The answer may surprise you as it’s not the airports themselves but a government agency known as NATs. NATs is responsible for the movement and positioning of aircraft whilst in UK airspace.

Experience tells us that the flight corridors and paths, created and managed by NATs, are very difficult and costly to change once established. So if you find yourself in a situation where you are being disrupted by aircraft it will be almost impossible to change and you will get little sympathy from the Government agencies . Meaning, it’s best to find out about the existence and usage of flight corridors and paths prior to purchasing a property. I.e. be informed! But how?

Unfortunately the “how” is not at all straight forward as although the flight information is available to the Government bodies there are no policies, guidance or standards about how the flight information should be presented to the payers of Stamp Duty.

Our objective is to lobby the UK Government departments to they can make the required changes to the Homebuyers Local Authority Searches to document the existence of local aircraft movements and flight corridors and paths. We believe the public have the right to know.

If you are interested in joining us on this journey then please leave your comments on the contact form below.

Aircraft disruption above our heads

Finding out what’s going on in the sky above your house or flat in the UK is almost impossible as there is no usable public information about aircraft flights and subsequent potential disruption.

Solicitors, Estate Agents and Home Buyer surveyors won’t know either. Aircraft flights are not in scope of Local Authority and even the airports and government authorities such as NATS, if asked, will provide a very blended superficial summary for the entire area that will not be specific to your plot. We think this is wrong as we deserve to know, hence the need to escalate with our MPs.

Software Apps such as flight trackers will not provide the required information that’s specific to your plot.

Thanks to the new Aircraft Traffic Assessment service it’s now possible to avoid that sinking feeling when you realise you have just purchased a new home that is subject to frequent or low level over flights caused by arrivals, departures and flight holding stacks.

However, the the noise and visual impact of aircraft can be very subtle and it’s easy and unfair to dismiss an entire area. Just 0.5 mile in one direction or another can make a huge difference to the scale and type of disruption.
  

About Articles and Comments

Articles, and associated comments provide additional insight about the aircraft sector and why noise and environmental issues are historically lightly regulated.

Simply select the relevant Article from the sub-menu option under “Articles ” .

Arrivals Flight Holding Stacks

The Aircraft Traffic Survey service is showing a growth in the use of the 90 second Arrival Holding Stack for flight separation which is a process used by NATs to prevent “bunching” when Arrival flights transition from unregulated airspace into the regulated airspace which is below 6,500 feet.

Understanding the existence of aircraft Arrival routes and Holding Flight stacks is very important when deciding on the area in which to purchase a home as the existence of flights means some form of disruption. It’s not something to discover once Stamp Duty and Solicitors costs have been paid.

Flight Arrivals, unlike flight Departures, are less regulated and are used at any time, 24 hours a day, 7 days a week. The Operational Management policies for flight Arrivals are totally owned, designed and managed by a Government body know as NATs. The NATs Air Traffic Controllers are responsible for the physical routes and altitudes taken by the individual aircraft when travelling within UK airspace. Some Air Traffic Controllers are based in regional centres, and others are seconded to the individual airports. NATs also subcontracts roles and responsibilities including the Air Traffic Controllers to 3rd party service companies. This structure makes change very complex to implement and over extended time frames.

NATs have created a number of Arrival flight holding stacks over the UK that are typically located 30-40 miles away from the destination airport. Their design resembles 7 oblong shaped circuits arranged vertically, the lowest being 7,000 feet and rising to 15,000 feet. The circuits are 10 miles in length and 6 miles wide and take around 4 minutes for an aircraft to navigate although many aircraft are “pulled” from the stack by NATs after 90 seconds by performing a tight banking manoeuvre.

Holding stacks tend to have a single entry point and multiple exit points and often hold 5-6 planes at the same time and as one aircraft exits another enters. Additionally, because they occur at above 7,000 feet they are very lightly (not) regulated for noise and air pollution even though the aircraft traffic volumes can be very high e.g. 30-60 planes per hour.

When is an Arrival Holding Stack used?

The NATs Air Traffic Controllers will decide and instruct the pilot when to pass directly through an Arrival holding stock or at what altitude to join the stack. Factors that can increase the usage of the stack include;

  • delays at the destination airport i.e. reached full capacity (highly likely)
  • flights arriving before the airport opens (highly likely)
  • flights arriving early (highly likely)
  • flight separation (highly likely)
  • bad weather (unlikely)
  • emergencies (unlikely)

Fortunately not all plots and homes are impacted in the same way even though they are in the same geographic area. This is because aircraft disturbance can be very localised. The overall impact is identified and assessed by the new Aircraft Traffic Survey service.